Resource Monitor Developer Guide
This guide will explain how to monitor the resource usage with the Resource Monitor.
Preparation
Before starting monitoring, you need to set up your device and PC using webOS CLI or webOS Studio.
Turn on the Developer Mode of your device
To measure the resource usage on your device, the Developer Mode of the device should be turned on. Fow how to turn on, see Turning Developer Mode on.
Register and connect the device
The device should be registered and connected to the PC where the Resource Monitor is installed. For how to connect, see Connecting TV and PC.
Install the app with the Developer Mode
To measure the resource usage of your app, the app should be installed with the Developer Mode. For how to install, see webOS CLI Developer Guide | Deploy the web app on a TV device or webOS Studio Developer Guide | Package, install, and launch the app.
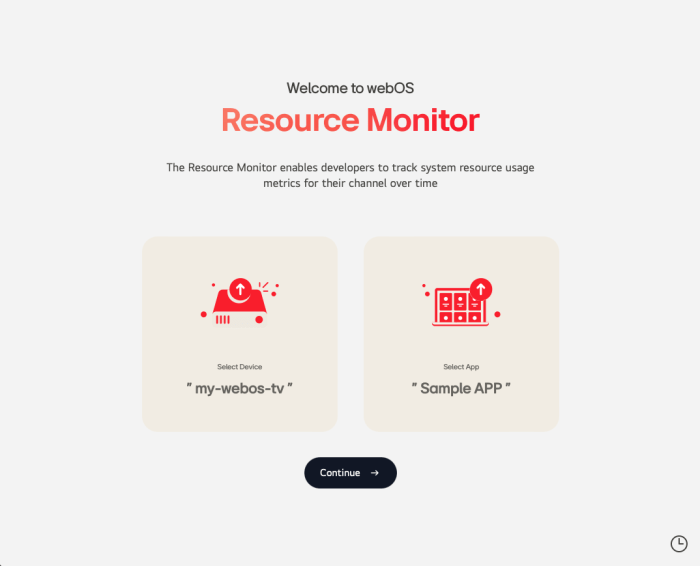
Select a device and app
First, select a device and app on and of which the resource usage is to be measured.
Select a device
- Click the Select Device box. The device list will be displayed.
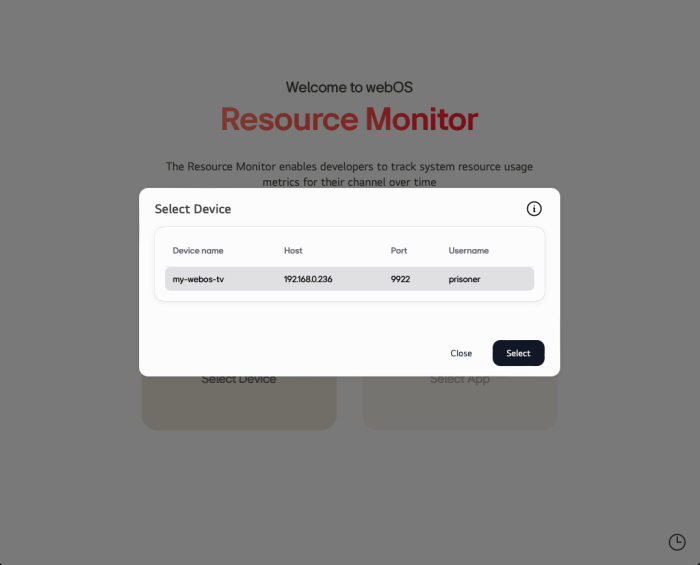
-
Select the target device and click Select.
-
On the device, approve the connection request.
- If you do not see the device, register the device first. See Register and connect the device.
- If you device is in the list but the connection request does not appear on the device, check the following:
- If the device registered in the PC is accessible through the network
- If the Developer Mode of the device is turned on
Select an app
-
Click the Select App box. The list of apps installed with the Developer Mode will be displayed.
-
Select the target app and click Select.
-
Click Continue to open the dashboard.
- If the app is not in the list, check if the target app is installed with the Developer Mode. Only the apps installed with the Developer Mode are shown in the list.
Change the target device or app
To change the target device or app,
-
Click the logo on the top, or
-
Click the device name displayed in the device information panel on the top right of the screen.
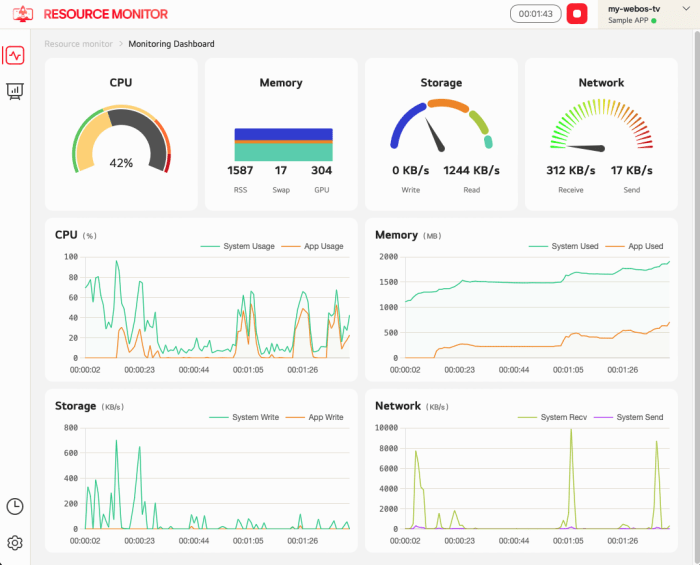
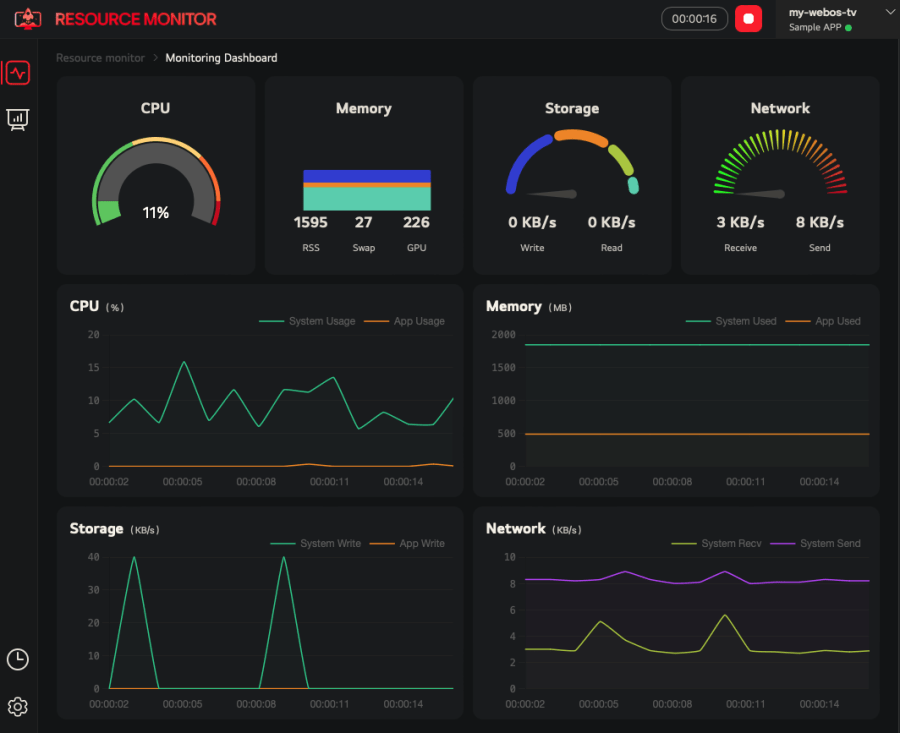
Dashboard
You can monitor the resource usage of the target device in real time.
Start and end measurement
- To start measurement, click the start button on the header bar on the top.
- To end measurement, click the stop button on the header bar on the top.
You will be asked whether to save the measured data. To save the data, click Save.
Real-time monitoring of the system resource usage
The four Gauge charts on the top section of the screen show the resource usage of the entire system in real time.
- CPU
- Memory (RSS + Swap + GPU)
- Storage
- Network
Resource data chart
The resource usage data measured up until now is displayed in charts.
- Key resource data are seen in a single view.
- The usage of the system and of the app can be compared.
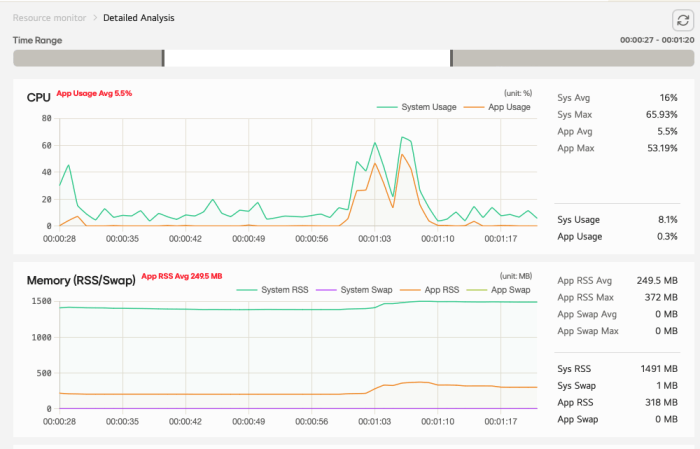
Data analysis
You can analyze the measured resource usage data with precision.
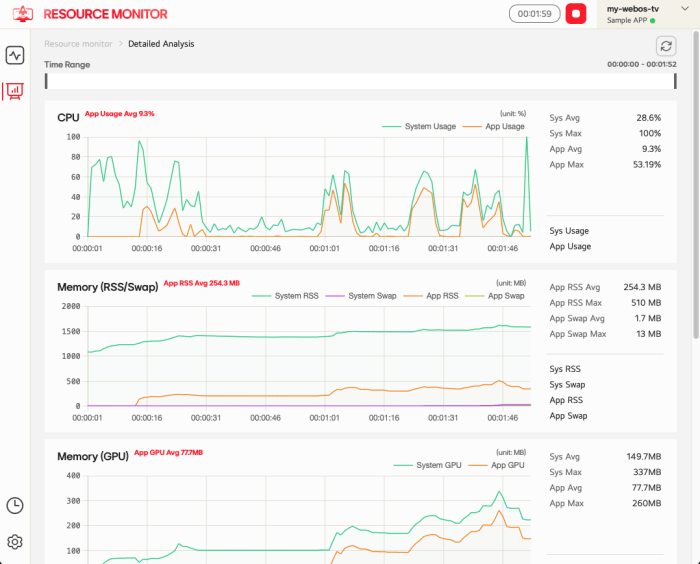
Comparison of data
The charts are aligned to the same time axis, so you can compare the resource usage data at a certain point of time.
- From the vertically-aligned charts, you can find the resource usage trend within a certain period of time.
- If you place a mouse cursor on a certain resource chart, other charts will be synced to the the same time point and show the data at the same time point.
Additional information
Useful statistical data, such as max, min, and average, are provided, so you can determine if there is any anomaly in the resource usage.
Selection of the time scope
You can select a specific time scope for in-depth analysis.
- By adjusting the time axis on the top, you can change the starting and ending point of the time scope for analysis.
- The adjustment of the time axis applies to all charts immediately.
History
The measured resource data can be saved, loaded, exported, or imported.
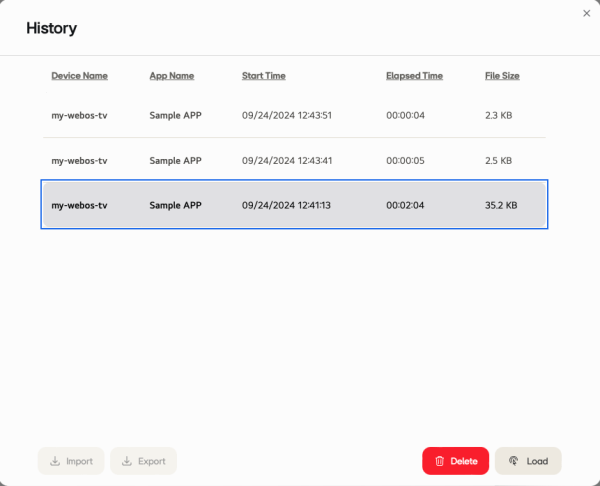
Save and load
When the measurement is over, you can save the data. Or you can load the saved data any time in History.
Export and import
You can download the saved data in History in a file and share the file with others if needed. The shared file can be loaded in the Resource Monitor tool installed in others' PC.
Settings
Light/Dark mode
You can select a light mode or dark mode theme.
Default interval
You can set the default time interval of measuring the resource usage.
Auto-start monitoring
If this option is on, the resource usage monitoring will start automatically as soon as you select a device and app, without having to click the start button.